Normalize data using Max Absolute & Min Max Scaling | Machine Learning | Python
- Hackers Realm
- Jun 21, 2023
- 6 min read
Normalizing data is a common preprocessing step in machine learning which refers to the process of transforming numerical data into a standardized format, typically within a specific range or distribution. The goal of normalization is to bring different features or variables onto a common scale, enabling fair comparisons and improving the performance of machine learning algorithms. Two commonly used methods for normalization are Max Absolute Scaling and Min-Max Scaling.

In this project tutorial we will explore how to normalize the data using max absolute & min-max scaling in python. Data Normalization is very important for data with uneven distribution. Normalized data helps in capturing information better for simpler algorithms
You can watch the video-based tutorial with step by step explanation down below.
Import Modules
import pandas as pd
import seaborn as sns
import matplotlib.pyplot as plt
import warnings
import numpy as np
warnings.filterwarnings('ignore')
%matplotlib inline
pandas - used to perform data manipulation and analysis
seaborn - provides a high-level interface for creating attractive and informative statistical graphics. Seaborn is particularly useful for visualizing relationships between variables, exploring distributions, and presenting complex statistical analyses
matplotlib.pyplot - used for data visualization and graphical plotting
warnings - used to control and suppress warning messages that may be generated by the Python interpreter or third-party libraries during the execution of a Python program
numpy - used to perform a wide variety of mathematical operations on arrays
Import Data
Next we will read the data from the csv file
df = pd.read_csv('data/winequality.csv')
df.head()
The code snippet reads a CSV file named 'winequality.csv' into a Pandas DataFrame object named 'df' and then displaying the first few rows of the DataFrame using the head() function

Next we will see the statistical summary of the DataFrame
df.describe()The describe() function in Pandas provides a statistical summary of the DataFrame, including various descriptive statistics such as count, mean, standard deviation, minimum value, 25th percentile (Q1), median (50th percentile or Q2), 75th percentile (Q3), and maximum value for each numerical column in the DataFrame

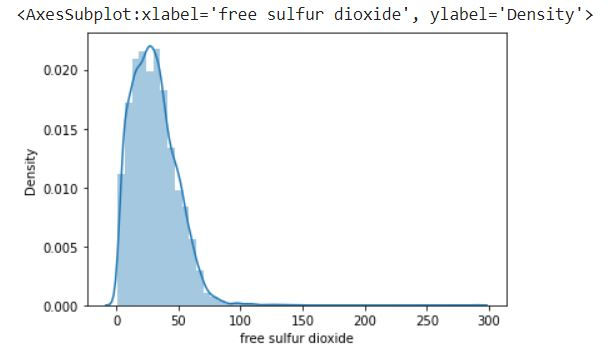
Next let us create a plot of the free sulfur dioxide column in the DataFrame
sns.distplot(df['free sulfur dioxide'])This will generate a distribution plot that displays the distribution of values in the 'free sulfur dioxide' column. The plot will include a histogram to visualize the frequency of different values and a smooth curve representing the kernel density estimate
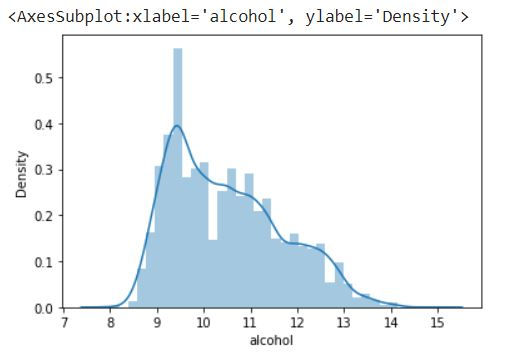
Next let us create a plot of the alcohol column in the DataFrame
sns.distplot(df['alcohol'])This will generate a distribution plot that displays the distribution of values in the 'alcohol' column. The plot will include a histogram to visualize the frequency of different values and a smooth curve representing the kernel density estimate
Next we will normalize the data. First we will use Max Absolute scaling to normalize the data
Max absolute scaling
Max Absolute Scaling scales the data based on the maximum absolute value of each feature. The formula to normalize a value using Max Absolute Scaling is normalized_value = value / max_abs_value
In this method, the maximum absolute value across all features is determined, and each value is divided by this maximum absolute value. The resulting values will be between -1 and 1
Let us see how we can normalize the data for the columns free sulfur dioxide and alcohol
First we will create a copy of a dataframe
df_temp = df.copy()Here we are creating a copy of the DataFrame df and assigning it to a new DataFrame called df_temp. This allows you to work with a separate copy of the data without modifying the original DataFrame df.
By using the copy() method, you create a deep copy of the DataFrame, meaning that any changes made to df_temp will not affect the original df DataFrame. This can be useful when you want to perform operations on the data or make modifications without altering the original dataset
Next we will be normalizing the 'free sulfur dioxide' column in the DataFrame df_temp using the Max Absolute Scaling method
df_temp['free sulfur dioxide'] = df_temp['free sulfur dioxide'] / df_temp['free sulfur dioxide'].abs().max()df_temp['free sulfur dioxide'].abs().max() calculates the maximum absolute value of the 'free sulfur dioxide' column. The abs() function is used to get the absolute values of each element in the column, and max() returns the maximum value
Next perform the normalization by dividing each value in the 'free sulfur dioxide' column by the maximum absolute value obtained in the previous step
The result is assigned back to the 'free sulfur dioxide' column in df_temp, replacing the original values with the normalized values
Next let us create a plot of the normalized free sulfur dioxide column in the DataFrame
sns.distplot(df_temp['free sulfur dioxide'])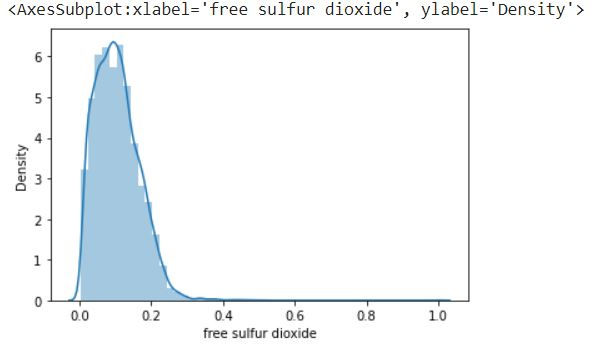
Now we can see the data range is from 0 to 1
Next we will be normalizing the 'alcohol' column in the DataFrame df_temp using the Max Absolute Scaling method
df_temp['alcohol'] = df_temp['alcohol'] / df_temp['alcohol'].abs().max()We will calculate the maximum absolute value of the 'alcohol' column using the same formula that we used for free sulfur dioxide column
Next let us create a plot of the normalized alcohol column in the DataFrame
sns.distplot(df_temp['alcohol'])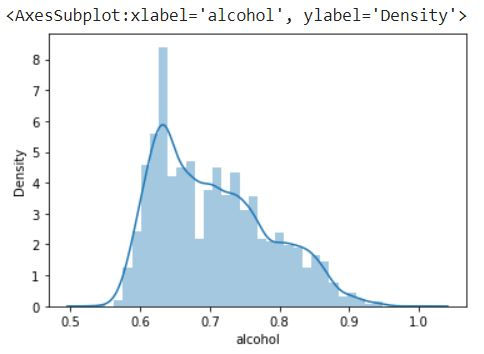
We can see the data range is from 0.5 to 1 and the min value is around 0.55 or 0.6
Now let us see how we can use Min-Max scaling to normalize the data
Min-Max Scaling
Min-Max Scaling scales the data between a specified range, typically between 0 and 1. The formula to normalize a value using Min-Max Scaling is normalized_value = (value - min_value) / (max_value - min_value)
In this method, the minimum and maximum values for each feature are identified. Each value is subtracted by the minimum value and divided by the range (max_value - min_value). The resulting values will be between 0 and 1
Let us see how we can normalize the data using this method
First we will create a copy of the DataFrame df and assign it to a new DataFrame called df_temp
df_temp = df.copy()Next we will be normalizing the 'alcohol' column in the DataFrame df_temp using the Min Max Scaling method
df_temp['alcohol'] = (df_temp['alcohol'] - df_temp['alcohol'].min()) / (df_temp['alcohol'].max() - df_temp['alcohol'].min())df_temp['alcohol'].min() calculates the minimum value of the 'alcohol' column
df_temp['alcohol'].max() calculates the maximum value of the 'alcohol' column
(df_temp['alcohol'] - df_temp['alcohol'].min()) subtracts the minimum value from each value in the 'alcohol' column, translating the range of values to start from zero
(df_temp['alcohol'].max() - df_temp['alcohol'].min()) calculates the range of values by subtracting the minimum value from the maximum value
Next divide each value in the 'alcohol' column by the range of values obtained in the previous step
The result is assigned back to the 'alcohol' column in df_temp, replacing the original values with the normalized values
Next let us create a plot of the normalized alcohol column in the DataFrame
sns.distplot(df_temp['alcohol'])
We can see that we have got a data range from 0 to 1 in min max scaling method
Log Transformation
Log transformation is a data transformation technique commonly used to reduce the skewness of data or to stabilize variance. It involves applying the logarithm function to the data values, which compresses large values and expands small values. This transformation can be useful when the data has a long tail or when the relationship between variables is better represented on a logarithmic scale
Let us see an example to demonstrate the use of this
First we will display a column
sns.distplot(df['total sulfur dioxide'])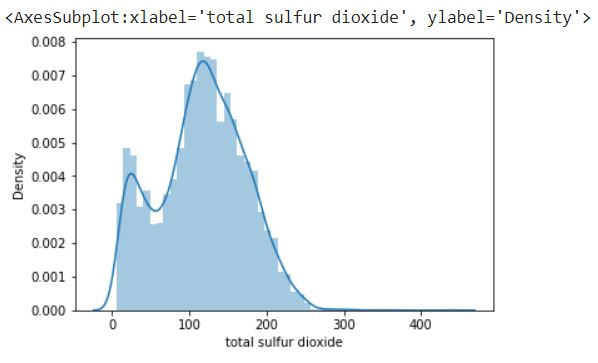
We can see that the curve is in right skewed manner
Next we will create a copy of the DataFrame df and assign it to a new DataFrame called df_temp
df_temp = df.copy()Next we will apply log transformation
df_temp['total sulfur dioxide'] = np.log(df_temp['total sulfur dioxide']+1)Add 1 to each value in the 'total sulfur dioxide' column. Adding 1 avoids taking the logarithm of zero or negative values since the logarithm function is undefined for those values
We will apply the natural logarithm (base e) to each value in the modified 'total sulfur dioxide' column
Next we will display the log transformed column
sns.distplot(df_temp['total sulfur dioxide'])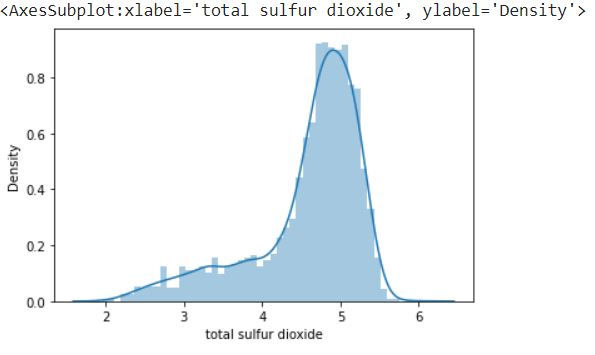
We can see that it has reduced the data range and also transformed the curve by reducing the skewness when compared to the plot without log transformation
Final Thoughts
Normalizing data is a crucial step in data preprocessing and analysis. It helps to standardize the scale and range of variables, making them comparable and ensuring that no variable dominates the analysis based on its magnitude.
Normalization also facilitates the convergence of certain machine learning algorithms that rely on scaled inputs
When normalizing data, it is important to consider the characteristics of the data and the specific requirements of your analysis. Some normalization techniques may work better for certain types of data or algorithms
Additionally, it is crucial to handle outliers, missing values, and zero or negative values appropriately to ensure the accuracy and validity of the normalization process
In this project tutorial we have seen how we can normalize the data using Max absolute scaling , Min max scaling and log transformation methods. In future we can extend this project by exploring other methods that are available to normalize the data
Get the project notebook from here
Thanks for reading the article!!!
Check out more project videos from the YouTube channel Hackers Realm


Comments