
Feature Selection using Chi Square (Category) | Machine Learning | Python
- Hackers Realm
- Jun 21, 2023
- 5 min read

Unleash the power of feature selection using Chi-Square (Category) in Python. Dive into machine learning techniques to optimize model performance. Learn how to select relevant categorical features, calculate chi-square statistics, and implement step-by-step feature selection methods. Enhance your understanding of the importance of feature selection and improve the efficiency of your machine learning models. Join us on this enlightening journey to master feature selection using Chi-Square in Python. #FeatureSelection #ChiSquare #MachineLearning #Python #DataAnalysis

In the context of feature selection, the Chi-square test can be used to evaluate the relationship between each feature and the target variable. By computing the Chi-square statistic and its associated p-value for each feature, you can assess their significance and select the most informative ones.
You can watch the video-based tutorial with step by step explanation down below.
Load the Dataset
First we will load the data and ensure that data consists of categorical or discrete variables
df = pd.read_csv('data/Loan Prediction Dataset.csv')
df = df[['Gender', 'Married', 'Dependents', 'Education', 'Self_Employed', 'Credit_History', 'Property_Area', 'Loan_Status']]
# fill null values
for col in df.columns:
df[col] = df[col].fillna(df[col].mode()[0])
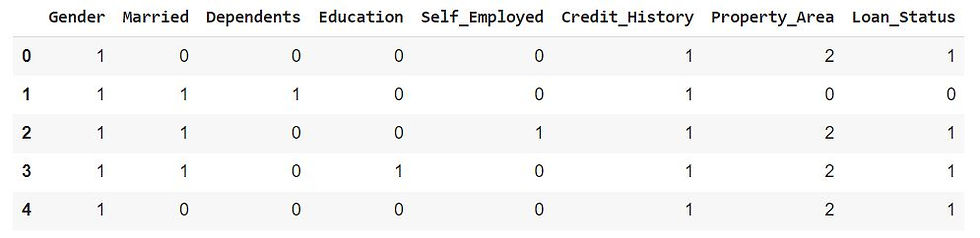
df.head()First we will read the CSV file 'Loan Prediction Dataset.csv' located in the 'data' directory and assign it to the DataFrame df using read_csv() function
Next select specific columns from the DataFrame df and reassign the DataFrame with only those columns. The selected columns are 'Gender', 'Married', 'Dependents', 'Education', 'Self_Employed', 'Credit_History', 'Property_Area', and 'Loan_Status'
Next we will iterate over each column in the DataFrame df. For each column, it fills any null values (NaN) with the mode (most frequent value) of that column using the fillna method. The mode is obtained by calling df[col].mode()[0]
Finally, the head() method is called on the DataFrame df to display the first few rows of the modified DataFrame

Label Encoding
Next perform label encoding on the columns of the DataFrame
# label encoding
from sklearn.preprocessing import LabelEncoder
for col in df.columns:
    le = LabelEncoder()
    df[col] = le.fit_transform(df[col])
df.head()
We will import the LabelEncoder class from scikit-learn, which provides the functionality for label encoding
Iterate over each column in the DataFrame df. For each column, a new instance of the LabelEncoder is created. The fit_transform method of the LabelEncoder is then used to fit the encoder to the column's data and transform the column into its encoded representation. The transformed values are assigned back to the corresponding column in the DataFrame
The head() method is called on the DataFrame df to display the first few rows of the modified DataFrame, where the categorical columns have been encoded
We can see that all the values are converted into numerical values
Compute the Chi-square statistic
First prepare the data for feature selection using chi-square
from sklearn.feature_selection import chi2
X = df.drop(columns=['Loan_Status'], axis=1)
y = df['Loan_Status']
We will import the chi2 function from the feature_selection module of scikit-learn. The chi2 function is used for chi-square statistical tests for feature selection
df.drop() creates a new DataFrame X by dropping the 'Loan_Status' column from the original DataFrame df. The drop function is used to remove the specified column, and the axis=1 argument indicates that the columns are being dropped
Next assign the 'Loan_Status' column from the original DataFrame df to the variable y. This column represents the target variable or the variable to be predicted
By separating the feature variables (independent variables) into the DataFrame X and the target variable (dependent variable) into the Series y, the code is preparing the data for feature selection using chi-square
Next we will obtain the chi-square scores
chi_scores = chi2(X, y)In this code, the chi2 function is applied to the feature variables X and the target variable y. It calculates the chi-square statistic for each feature in X with respect to the target variable y. The resulting chi_scores variable will contain the chi-square scores for each feature
Next we will display these chi_scores to analyze the significance of each feature in relation to the target variable
chi_scores(array([3.62343084e-02, 1.78242499e+00, 8.59527587e-02, 3.54050246e+00,
7.28480330e-03, 2.60058772e+01, 3.77837464e-01]),
array([8.49032435e-01, 1.81851834e-01, 7.69386856e-01, 5.98873168e-02,
9.31982300e-01, 3.40379591e-07, 5.38762867e-01]))
These are chi-square score values , higher the value higher the importance of the target variable
Visualize the Chi-Square Scores
We will show the chi-square scores for each feature, where higher scores indicate higher importance or stronger associations with the target variable in the form of bar plot
# higher the chi value, higher the importance
chi_values = pd.Series(chi_scores[0], index=X.columns)
chi_values.sort_values(ascending=False, inplace=True)
chi_values.plot.bar()
We will create a pandas Series called chi_values using the chi-square scores from the first element of chi_scores. The index of the Series is set to the column names of the DataFrame X
Next sort the chi_values Series in descending order based on the values. The ascending=False argument ensures a descending sort. The inplace=True argument modifies the chi_values Series in place
chi_values.plot.bar() plots the sorted chi_values Series as a bar plot. Each bar represents a column from the DataFrame X, and the height of the bar corresponds to the chi-square score

From the bar plot we can infer that credit_history is important to approve the loan . Based on this we can say that whether the loan will be approved or not , higher the value higher the importance
Next we will plot a bar plot based on p-values
# if p-value > 0.05, lower the importance
p_values = pd.Series(chi_scores[1], index=X.columns)
p_values.sort_values(ascending=False, inplace=True)
p_values.plot.bar()
We will create a pandas Series called p_values using the p-values from the second element of chi_scores. The index of the Series is set to the column names of the DataFrame X
Next sort the p_values Series in descending order based on the values. The ascending=False argument ensures a descending sort. The inplace=True argument modifies the p_values Series in place
Net we will plot the sorted p_values Series as a bar plot. Each bar represents a column from the DataFrame X, and the height of the bar corresponds to the p-value

Higher the p-value lower the importance. From the bar plot we can infer that Self_Employed, Gender and Dependents does not have much importance as the p-values are greater than 0.5 and Married, Education and Credit_History are important as it has low p-values
Final Thoughts
Chi-square is most appropriate for categorical variables, where each value represents a distinct category or level. It may not be suitable for continuous or ordinal variables without appropriate discretization
Chi-square assumes that the variables being tested are independent of each other. Therefore, it may not capture more complex relationships, such as non-linear or interactive effects. It's important to consider this assumption and complement chi-square with other feature selection techniques if needed
While chi-square can identify significant associations between variables, it does not provide information about the strength or direction of the relationship. Additionally, chi-square may be sensitive to sample size, so caution should be exercised when working with small datasets
Using chi-square, you can rank features based on their scores or p-values. This ranking allows you to prioritize the most informative features for further analysis or model development
In summary, chi-square is a useful tool for feature selection, especially when dealing with categorical variables. It provides insights into the association between features and the target variable. However, it's essential to consider its assumptions and limitations, and it's often beneficial to combine it with other techniques for a more comprehensive feature selection process
In this article we have explored how we can perform feature selection using chi square. In future articles we will explore different methods to perform feature selection.
Get the project notebook from here
Thanks for reading the article!!!
Check out more project videos from the YouTube channel Hackers Realm


Comments